Comet Time Series (TS)
A Software Package to Facilitate Time-Series Analysis of Satellite Imagery
Comet Time Series (CometTS) is a software package and tool that enables workflows for the analysis and visualization of a time series of satellite imagery for the data science and geographic science communities. The tool aims to enable population estimation research, land use change detection, or natural disaster monitoring using a range of data types. CometTS calculates relevant statistical quantities (e.g., measures of central tendency and variation) and provides a visualization of their changes over time. The package can help to serve as a rapid inspection workflow and analyze multiple regions of interest (ROI)’s in seconds.
CometTS has been employed to monitor electrical and infrastructure recovery in Puerto Rico following Hurricane Maria. For this study, the tool was used to extract the change in average nighttime brightness for all census tracts within Puerto Rico and to infer the number of persons without power over time. Multiple opportunities exist to employ CometTS for impactful work in the future including:
- Population dynamics
- Land-use change
- Investigating seasonal or climatic conditions such as drought
Visualizations and analyses derived from CometTS in these topics can inform better understanding of changes to climate, poverty, food security, biodiversity, political conflict, and civil instability.
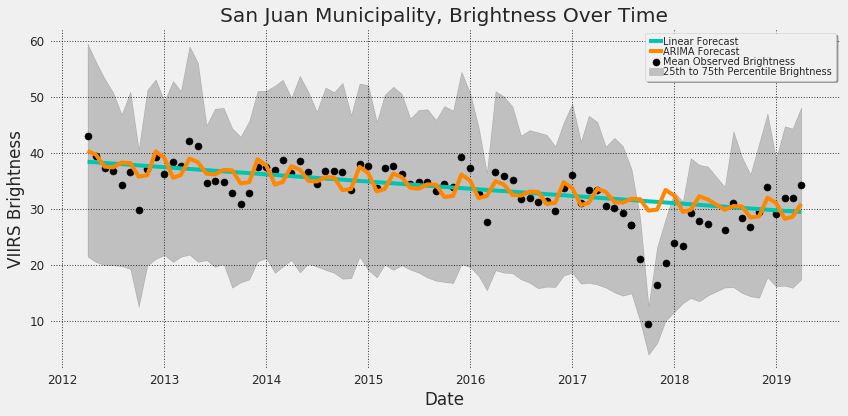
A visualization of mean observed brightness before and after Hurricane Maria in the San Juan Municipio, Puerto Rico. The linear regression forecast, and seasonal adjusted forecast are plotted in teal and orange respectively. Differences of observed vs. expected brightness can be visualized and quantified.